Market metrics thru 7/2 - stock indexes, treasury yields, and gold, silver, and oil over the past 4 weeks [View all]
This discussion thread is pinned.
Last edited Sun Jul 5, 2026, 08:30 AM - Edit history (14)
building on Lastlib's every Friday market metrics in Personal Finance and Investing Group
Thursday July 2 is the last day of the market week because markets were closed Friday July 3 for 4th of July Weekend.
Percent changes Last 7 days and last 4 weeks (since June 5)

The yield changes are the percentage points differences,
e.g. if some Treasury went from 3.61% to 3.66% over the past week. then that is a change of +0.05%
Red numbers in ()'s are negative numbers, meaning the metric went down.
Treasury notes' yields up means the notes' values are down
as likely people's bond portfolios
All time closing highs --
S&P 500: 7609.78 on 6/2
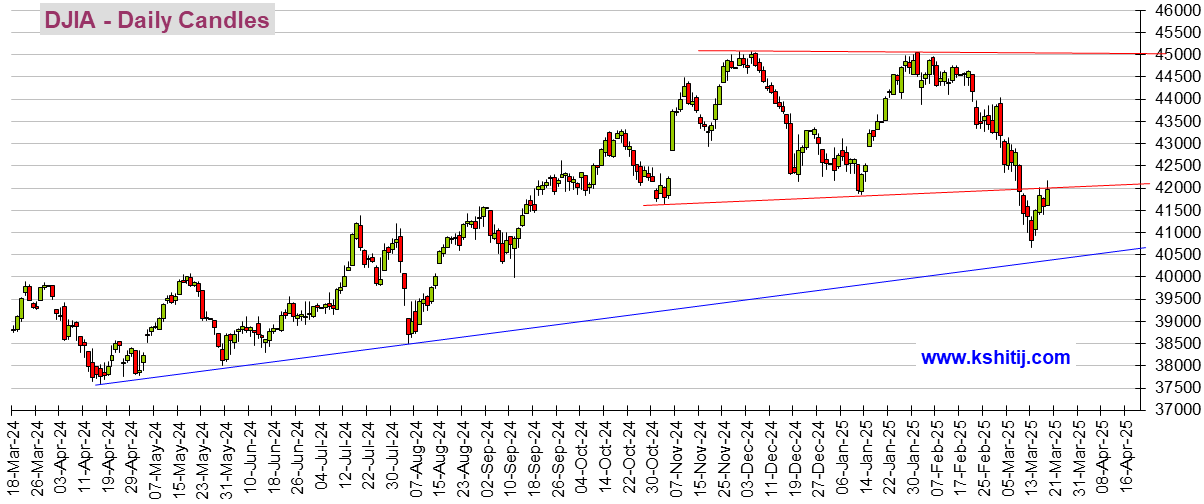
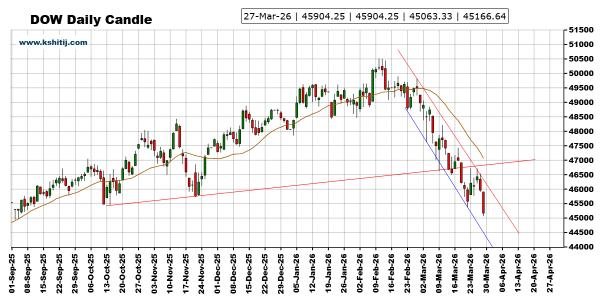
DOW: 50,188 on February 10, and then in May, June, and July has been lately setting frequent new all time highs. The 7/2 value shown, 52,900, is a new all-time high
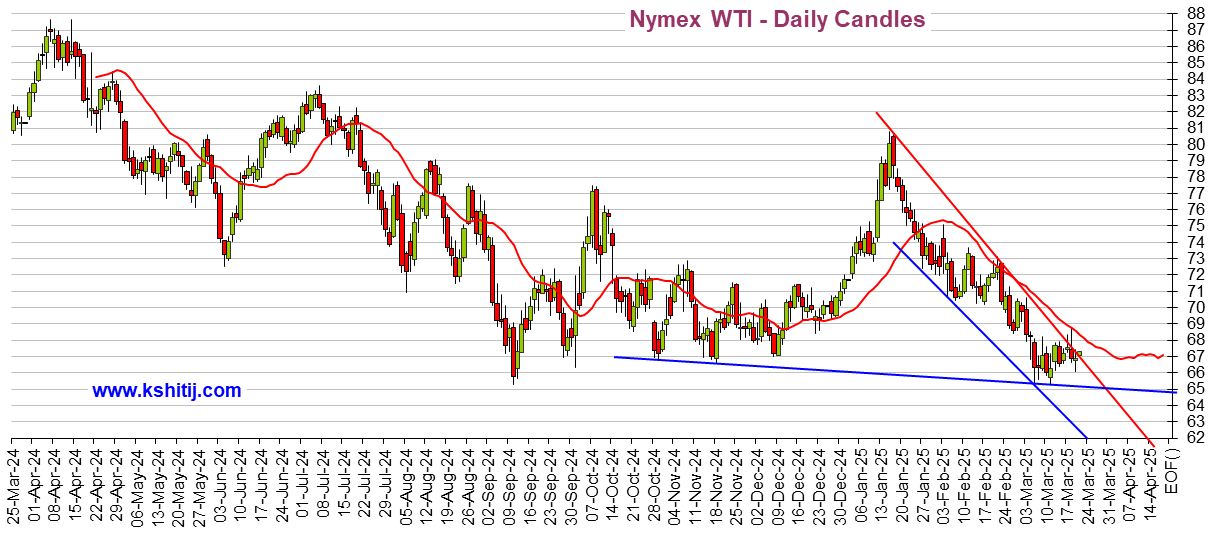
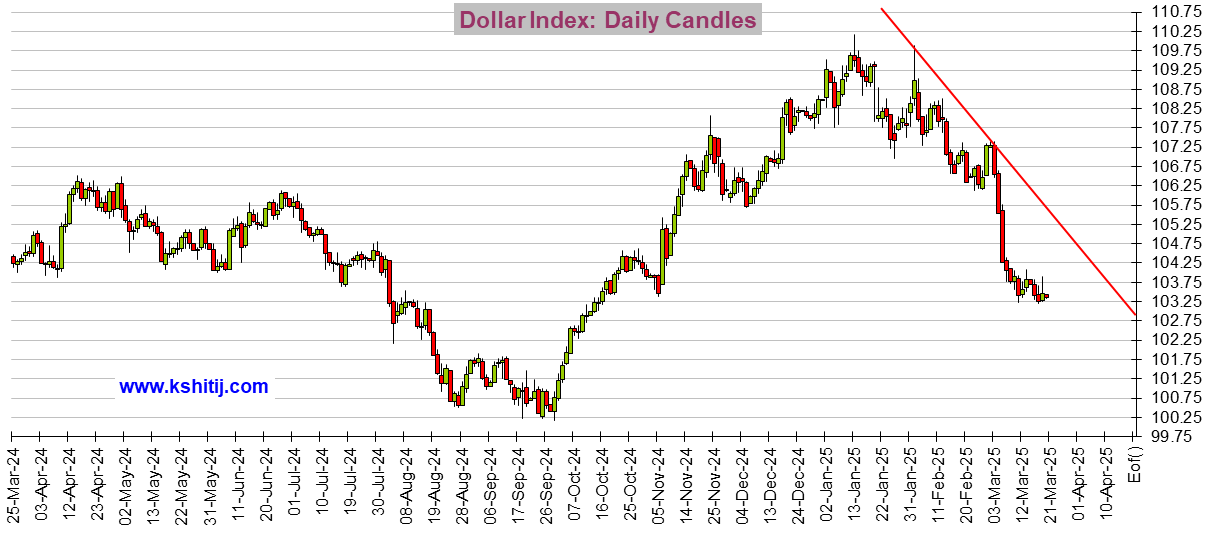
For a 6- to 9-month perspective, depending on which graph, I like pasting these in because the automatically update. I wish I had one for the S&P 500, but I don't, oh well.
Dow, Oil, and Dollar (last several months) - they update a few hours (like about 6 hours) after the close
The attacks on Iran began on February 28.
Dow 30,
3/28 3:04 PM ET - I don't know why the big one hadn't updated so I added the little version which was more up-to-date
https://kshitij.com/graph-gallery/equities/dowjones-candles-Daily
?0.5749081749552942
Crude Oil
 US Dollar Index (DX-Y.NYB)
The graphs above
update automatically. So they are up-to-date a few hours after each close (usually).
There should be 4 graphs above.
If you see little image squares and no graphs, right click on each such image square and choose Load Image.

 = new reply since forum marked as read